University of California, Davis

Category: Research

Is your phylogeny informative?

(crossposted from my lab notebook)

Yesterday my paper [cite]10.1111/j.1558-5646.2012.01574.x[/cite] appeared in early view in Evolution,As the open access copy doesn’t appear on pubmed for a while, you can access my author’s copy here. so I’d like to take this chance to share the back-story and highlight my own view on some of our findings, and the associated package on CRAN.Just submitted, meanwhile, the code is always on github.

I didn’t set out to write this paper. I set out to write a very different paper, introducing a new phylogenetic method for continuous traits that estimates changes in evolutionary constraint. This adds even more parameters than already present in rich models multi-peak OU process, and I wanted to know if it could be justified — if there really was enough information to play the game we already had, before I went and made the situation even worse. Trying to find something rigorous enough to hang my hat on, I ended up writing this paper.

The short of it

There’s essentially three conclusions I draw from the paper.

  1. AIC is not a reliable way to select models.
  2. Certain parameters, such as \(\lambda\), a measure of “phylogenetic signal,” [cite]10.1038/44766[/cite] are going to be really hard to estimate.
  3. BUT as long as we simulate extensively to test model choice and parameter uncertainty, we won’t be misled by either of these. So it’s okay to drink the koolaid [cite]10.1086/660020[/cite], but drink responsibly.

A few reflections

I really have two problems with AIC and other information criteria when it comes to phylogenetic methods. One is that it’s too easy to simulate data from one model, and have the information criteria choose a ridiculously over-parameterized model instead. In one example, the wrong model has a \(\Delta\)AIC of 10 points over the correct model.

But a more basic problem is that it’s just not designed for hypothesis testing — it doesn’t care how much data you have, it doesn’t give a notion of significance. If we’re ascribing biological meaning to different models as different hypotheses, we need want a measure of uncertainty.

When estimating parameters that scale branch length, I think we must be cautious because these are really data-hungry, and don’t work well on small trees. Check out how few of these estimates of lambda on 100 replicate datasets hit near the correct value shown by vertical line:
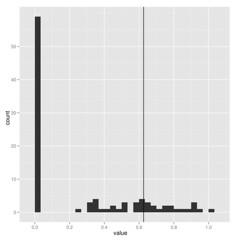
The package commands are explained in more detail in the package vignette, but the idea is simple. Running the pmc comparison between two models (for the model-choice step) looks like this:

[code lang=”R”] bm_v_lambda <- pmc(geospiza.tree, geospiza.data["wingL"],
"BM", "lambda", nboot=100)
[/code]

Extracting the distribution of estimates for the parameter lambda got from fitting the lambda model (B) to data made by simulating under lambda model (A):

[code lang=”R”] lambdas <- subset(bm_v_lambda["par_dists"],
comparison=="BB" & parameter=="lambda")
[/code]

To view the model comparison, just plot the pmc result:

[code lang=”R”]plot(bm_v_lambda)[/code]

The substantial overlap in the likelihood ratios after simulating under either model indicate that we cannot choose between BM and lambda in this case. I’ll leave the paper to explain this approach in more detail, but it’s just simulation and refitting.
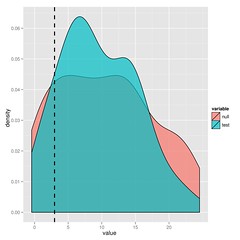
You could just bootstrap the likelihoods or for nested models, look at the parameter distributions, but you get the maximum statistical power from the ratio (says Neyman-Pearson Lemma).

A technical note: mix and match formats

Many users don’t like going between ouch format and ape/phylo formats. The pmc package doesn’t care what you use, feel free to mix and match. In case the conversion tools are useful, I’ve provided functions to move your data and trees back and forth between those formats too. See format_data() to data-frames and convert() to toggle between tree formats.

Reproducible Research

The package is designed to make things easier. It comes with a vignette (written in sweave) showing just what commands to run to replicate the results from the manuscript.

This entire project has been documented in my open lab notebook from its inception. Posts prior to October 2010 can be found on my OWW notebook, the rest in my current phylogenetics notebook (here on wordpress). Of course this project is interwoven with many notes on related and more recent work.

Additional methods and feedback

As we discuss in the paper, simulation and randomization-based methods have an established history in this field[cite]10.1371/journal.pbio.0040373[/cite], [cite]10.1111/j.1558-5646.2010.01025.x[/cite]. These are promising things to do, and we should do them more often, but I might make a few comments on these approaches.

We are not getting a real power test when we simulate data produced from different models whose parameters have been arbitrarily assigned, rather than estimated on the same data, lest we overestimate the power. Of course we need to have a likelihood function to be able to estimate those parameters, which is not always available.

It is also common and very useful to assign some summary statistic whose value is expected to be very different under different models of evolution, and look at it’s distribution under simulation. This is certainly valid and has ties to cutting edge approaches in ABC methods, but will be less statistically powerful than if we can calculate the likelihoods of the models directly and compare those, as we do here.

Live from the fish bowl

Here are some pictures of our Cal Academy team measuring fish in the project room at the California Academy of Sciences in SF. The lab has been coming here since the summer, and with the help of two undergraduates are measuring morphology on close to 250 fish species. Since there were four of us today, we needed more space and worked on display so all could see us dangling fish from sutures to get photos for center of mass estimates.

Our specimens

The team, minus one post-doc

Two post-docs hard at work

An up and coming ichthyologist

Taking lateral photos for center of mass measurements

Where do they get all those wonderful videos?

This blog is also posted on my personal blog.

I joined the Wainwright lab in October of last year. While I had experience with swimming fish, including high-speed video analyses, I had not done any filming of fish feeding. At the beginning of this year I got my first taste of obtaining high-speed videos of fish suction feeding. Since that time I have been amazed at the diversity of fish the lab studies (for example, check out the Inimicus didactylus video), the speed of the strikes, and kinematics during the strike; some of the little fish have quite a big gape to capture their prey. The data we are gathering is allowing us to get a glimpse of the patterns of diversity in the kinematics during suction feeding among various species of marine fish, as well as the potential morphological and mechanical correlates of that kinematic data.

Many of the videos that we obtain as a result of this research we upload to our Youtube channel to share with the public, usually the best videos, in focus and lateral. When we film we always try to get focused and lateral sequences for subsequent digitizations. These clear lateral videos allow us to digitize several landmarks on the fish during the strike sequence to get several kinematic variables such as maximum gape, time to pre capture, and ram speed to name a few. But we don’t just need clear lateral videos to showcase on Youtube; we mainly need clear videos to be able to track the landmarks throughout the sequence, and we need lateral videos to obtain accurate kinematics. For example, if the sequences are not clear, it may be harder to track a landmark and there may be more error because the points may drift. If the fish isn’t completely lateral, we may not be able to see all the points, or if the fish as at an angle (going into the third dimension, such as toward the back of the aquarium, which we don’t capture in the 2-dimensional video) the kinematic variables may not be accurate. So, there is a reason for us obtaining these clear lateral videos. However, we also recognize that some of these strike sequences are pretty amazing, so we share them on Youtube.

Lately, our videos (especially the Inermia vittata video you can see in a previous post) have attracted the attention of several science, news and tech blogs. Thank you to all that have posted our videos. However, obtaining these videos is not always easy work, something else that I have learned since being a part of the Wainwright lab. Obtaining these sequences can sometimes (and often) take lots of hours of filming, patience, and hard work. Much of this depends on the fish or the species. Some fish are very good performers, and obtaining several good sequences does not take long (for example the Histrio histrio you can in another previous post). Others require some training to get the fish use to the lights required to capture the sequences at 1000 frames per second. Furthermore, not every fish feeds perfectly lateral every time, or we have multiple individuals in the aquarium that all want food, and the fish themselves are not always perfect. In fact, there are plenty of instances when the predator will miss the prey. This itself is interesting; a former Wainwright Lab member Tim Higham has done some work on the accuracy of strikes, what makes a predator accurate and what can make them miss? Perhaps having a farther strike distance and faster strike velocity decreases accuracy, but to compensate, species have larger gapes to ingest a greater amount of water to increase chances of prey capture (e.g., Higham et al. 2007). We recently posted a video on our Youtube channel of some of these ‘outtakes.’ Again, it is not always easy to capture the clear lateral videos and it takes a lot of work, so this video highlights a ‘bad day at the office’.

Patrick Fuller on feeding duty, Tomomi Takada on camera duty during a typical filming session.

So how do we get all these wonderful videos? First, it is almost always a two person job (although Matt has filmed sticklebacks alone). One person feeds the fish, trying to get them in view of the camera, and striking laterally. This job is almost an art form in itself. You have to learn the behavior of the fish; are they sit and wait predators like the frogfish, fast strikers like the white-streaked grouper, or more active swimmers like Inermia vittata? Therefore, the person feeding has to be aware of the fish’s behavior to try and get good sequences. Challenges may also arise is there are multiple individuals.

Another view of a filming session

We want to ensure all fish eat and we want to get sequences from all individuals, so the person feeding has to keep track of the fish or target the various individuals. The other person involved in the process is the person responsible for tracking the prey and predator, focusing the camera and triggering the high-speed camera. This job is also not easy. It takes some skill to track and focus and quickly trigger the camera. We film at 1000 frames per second and many of the videos on Youtube are played back at 10 frames per second. So what do these strikes actually look like in real time, how much time does the person manning the camera have to respond? To demonstrate this we made a video of a full sequence captured during filming,  in real time and about 200ms of that sequence played back at 10 frames per second for comparison. The person on camera duty has 3 seconds to trigger. You can see from the video, the person responsible for this part of filming either has, or hopefully obtains quick reflexes!

Although our Youtube channel features some of the best sequences we capture, keep in my mind we always strive to get the best videos. And the next time you see one of our videos on Youtube or elsewhere remember that one video is probably the product of hours of work. I want to also note that many of these videos are the work of undergraduate assistants we have in the lab. Many of our Youtube ‘stars’ were captured by our undergraduates, their assistance has been greatly appreciated and many of these videos would not have been captured without them.

Size, Scales and Sceloporus

This weeks blog (also posted on my blog) is a departure from fish, but is about a recent paper of mine that uses phylogenetic comparative methods to test hypotheses for body size and scale evolution among Sceloporus lizards.

Oufiero, C.E.$, G.E.A. Gartner$, S.C. Adolph,  and T. Garland Jr. 2011. Latitudinal and climatic variation in scale counts and body size in Sceloporus lizards:  a phylogenetic perspective. In press  Evolution. DOI: 10.1111/j.1558-5646.2011.01405.x
$ These authors contributed equally

This summer the lab has a reading group on phylogenetic comparative methods, where we are reading through some of the classic phylogenetic papers discussing the various methods. This past week we focused our attention on phylogenetic generalized least squares methods or PGLS. This method was introduced by Grafen in 1989, and although it wasn’t initially a common phylogenetic comparative approach, has seen more use in recent years. For those not familiar with this method, it utilizes a regression approach to account for phylogenetic relationships. In this method the phylogeny is converted to a variance-covariance matrix, where the diagonals in the matrix represent the “summed length of the path from the root of the tree to the species node in question (Grafen 1992).” That is, how far each tip is from the root; in an ultrametric tree the diagonals in the variance-covariance matrix will all be the same. The off diagonals represent the “shared path length in the paths from the root to the two species (Grafen 1992)”. In other words, the off diagonals are the distance from the root to the last common ancestor for the two species. Similar to independent contrasts, this method assumes Brownian motion evolution; however, unlike independent contrasts PGLS assumes the residual traits are undergoing Brownian motion evolution, whereas independent contrasts assumes the characters themselves are undergoing Brownian motion evolution. The other main difference  in PGLS is the use of raw data instead of computing independent contrasts. In short, the PGLS approach is similar to a weighted regression, where the weighted matrix is the variance-covairnace matrix based on the phylogeny of the group, and assuming the same phylogeny will produce the same results as independent contrasts.

So what does this have to do with size, scales and Sceloporus? Well, in a recent study we used a PGLS approach to examine patterns of body size and scale evolution in relation to latitude and climate among Sceloporus lizards. Sceloporus (fence and spiny lizards) are a group of more than 90 species of lizards found from Central America up to Washington State in the U.S. Throughout their range they experience a diversity of habitats, from deserts to tropical forests to temperate forests; and have been used in many studies examining physiological ecology, life history evolution and thermal biology. In our study we used Sceloporus to test two hypotheses for the evolution of morphology. 1) Lizards  exhibit an inverse Bergmann’s Rule, with larger individuals found at lower latitudes and/or warmer climates. 2) Lizards from hotter environments will exhibit fewer and thus larger scales to aid in heat dissipation; whereas lizards from colder environments will exhibit more/smaller scales to aid in heat retention. There has been conflicting results for these hypotheses in the literature, and latitude has often been used as a proxy for climate. However, one of the unique things about our study is the incorporation of multivariate techniques to describe habitat. We use latitude as a predictor as well as climatic variables (temperatures, precipitation and a composite aridity index Q), and also utilize principal component analysis to characterize habitat. We therefore can test for specific climate predictors of these traits without assuming that higher latitudes necessarily equate to colder environments.

To test our hypotheses we gathered data on 106 species and populations of Sceloporus from the literature and museum specimens. We obtained latitude from the literature and source maps, and climate date from the International Water Management Institute’s World Water and Climate Atlas (http://www.iwmi.cgiar.org/WAtlas/Default.aspx). Using a recent phylogenetic hypothesis for Sceloporus (Wiens et al. 2010) we examined the relationship between maximum snout-vent length with latitude and 5 climatic predictors under three models of evolution (no phylogenetic relationships (OLS), Brownian motion (PGLS) and a model in which the branch lengths are transformed in an Ornstein-Uhlenbeck process (RegOU). To examine hypothesis 2 we examined a multiple regression with dorsal scale rows as the dependent, body size as a covariate and latitude or one of the 5 climatic predictors as independents. We also compared results with principal components 1-3 as predictors of dorsal scale counts.

So what did we find? First, we found that phylogenetic models (PGLS or RegOU) were always better fit than non-phylogenetic (OLS) based on likelihood ratio tests and AICc scores. We also found that as latitude increases mean and minimum temperatures decrease, as well as precipitation and aridity, but maximum temperature tends to increase. Thus, lizards from this group found at higher latitudes may be experiencing more desert like environments. 

For hypothesis 1, we found support for the inverse of Bergmann’s Rule when viewed from a climatic perspective; larger lizards were found in areas with higher maximum temperatures, but not at lower latitudes. We also found that larger lizards were found in more arid environments.

Photo copyright Mark Chappell

Our results for hypothesis 2 were a little more complex. We did not find support for the first part of hypothesis 2, lizards with fewer scales were not found in hotter environments. We did find support for the second part of hypothesis 2, lizards with more scales are found in environments with lower minimum temperatures. We also found a positive effect of latitude, and a significant negative effect of aridity (with lizards with more scales inhabiting more arid environments). Results with principal components were also consistent, with PC1  (a latitude/temperature axis) having a significant negative effect on scale count; and PC2 (a maximum temperature/precipitation axis) having a significant positive effect.

Our results suggest several things. First, latitude alone may not be an accurate description of the environment organisms face, particularly at the finer spatial scales over which an individual species may exist. Second, we found support for the inverse of Bergmann’s Rule at the inter-specific level, which has also been found to be a consistent trend intra-specifically in some ectotherms (see Ashton and Feldman 2003). Finally, our analyses suggest that both temperature and precipitation (hence aridity) are important to the evolution of scale counts in this group. These findings also suggest that scale size may be important for other physiological processes, such as evaporative water loss (lizards in more arid environments may have more/smaller scales to reduce rates of evaporation through the skin as has been suggested by Soulé and Kerfoot 1972 ). Examining the relationship of morphological traits that may function in physiological processes may provide insight into how these organisms may respond to global of climate change.

Stickleback attack (part 1)

Since our last video posting, many of the videos on our lab’s Youtube channel have gone viral. As of this blog post, the video of Inermia vitatta has accrued over 120,000 hits and has been featured on TV programs and newspaper articles around the globe. Not bad for a small fish!

[youtube=http://www.youtube.com/watch?v=psdLbN7skg4]

Today’s video features the threespine stickleback, Gasterosteus aculeatus, feeding on a cladoceran (Daphnia pulex). If you have a short attention span like me, one of the first things you’ll notice from the video is how shiny the fish is. The reflective armor plates and large spines are a clue that this is a threespine stickleback from an anadromous population. Anadromous stickleback have a life history similar to a miniature salmon – they are born in freshwater, travel to the ocean, then return to freshwater to breed. Unlike salmon, anadromous stickleback do not necessarily return to their home stream to breed. Anadromous stickleback also look very similar to each other – an Alaska anadromous fish looks very similar to a California anadromous fish.

Sometimes, these anadromous stickleback will travel to a newly-formed lake or river, and instead of returning to the ocean, some fish will stay in freshwater, founding a new population of freshwater stickleback. Over time, this freshwater population will evolve to better match its new freshwater habitat.

These anadromous and freshwater populations are one of the reasons stickleback are such a good system for studying evolutionary biology. We can study the result of rapid evolution in the freshwater populations, and then turn around and study the anadromous fish that resemble the fish that founded the freshwater population. Studying ancestral and derived populations is one of the few ways – short of a time machine – that we can learn the dynamics of adaptation in natural populations.

If we study how this anadromous stickleback captures prey, and then study how freshwater stickleback catch prey, we can learn a lot about the process of adaptation. I’ve devoted much of my PhD work to studying this system, and I’ll be talking more about it in future posts.

Is this fish crazy?

This post is cross-posted with my personal website’s Blog.

We recently got some new fish in the lab, Butis butis, commonly called the crazy fish or Duckbill Sleeper. This is a fresh water fish, originating from East Africa to Fiji and belongs to the Eliotridae. These fish get to a maximum size of about 15 cm total length, live in brackish mangrove swamps and estuaries, feeding on small fish and crustacean, and is commonly found in the hobby industry.

The question is, are these fish in fact crazy? These fish tend to be unique because they can be seen swimming, floating, and even eating upside down. This behavior has been noted in nature and in aquariums, where they will also be seen pressed up the glass. They tend to be ambush predators and are often found floating among plants, in any position. Having them in the lab, we have begun filming them and have been able to capture their feeding right-side up and upside down. What will be interesting to see is if the kinematics of their feeding differs between the orientations, as well as if one orientation is better than the other at eliciting successful strikes. In the meantime, enjoy the videos of these crazy fish feeding in the two orientations.

Upside down filmed at 1000 frames per second, played back at 10 frames per second.

Right-side up filmed at 1000 frames per second, played back at 10 frames per second.

© 2024 Wainwright Lab

Theme by Anders NorenUp ↑