University of California, Davis

Month: August 2011

FishBASE from R

In lab known for its quality data collection, high-speed video style, writing the weekly blog post can be a bit of a challenge for the local code monkey. That’s right, no videos today. But lucky for me, even this group can still make good use of publicly available data. Like the other day, when one of our newer graduate students wanted to do a certain degree of data-mining from information available from FishBASE. Now I’m sure there are plenty of reasons to grumble about it, but there’s quite an impressive bit of information available on FishBASE, most of it decently referenced if by no means comprehensive. And getting that kind of information quickly and easily is rapidly becoming a skill every researcher needs. So here’s a quick tutorial of the tools to do this.

Okay, so what are we talking about? Let’s start with an example fishbase page on Nile tilapia:
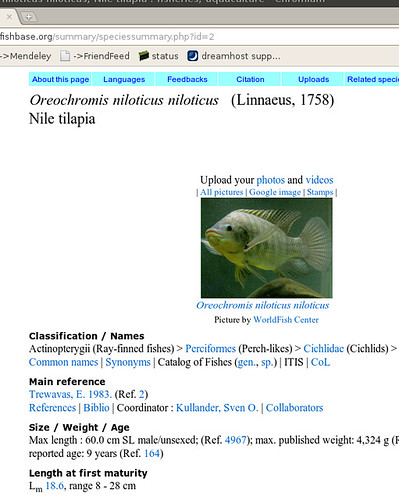
Okay, so there’s a bunch of information we could start copying down, then go onto the next fish. Sounds pretty tedious for 30,000 species… Now we can get an html copy of this page, but that’s got all this messy formatting we’ll have to dispense with. Luckily, we scroll down a little farther and we see the magic words:

Download XML

The summary page takes us to just what we were looking for:

To the human eye this might not look very useful, but to a computer, it’s just what we wanted. ((Well, not acutally. A RESTful interface to this data would be better, where we could query by the different categories, finding all fish of a certain family or diet, but we’ll manage just fine from here, just might be a bit slower)) It’s XML – eXtensible Mark-up Language: meaning it’s all the stuff on the previous page, marked up with all these helpful tags so that a computer can make sense of the document. ((Actually, not everything on the html page. Between the broken links, there’s tons of information like the life history tool, diet data references, etc that somehow haven’t made it into the XML summary sheet.))

To process this, we’ll fire up our favorite language and start scripting. To access the internet from R we’ll use a the command-line url browser, curl, available in the RCurl package. We’ll process XML with the XML package, so let’s load that too. Install these from CRAN if you don’t have them:

[source lang=”r”] require(XML)
require(RCurl)
[/source]

Click on that XML link to the summary page, and note how the url is assembled: http://fishbase.sinica.edu.tw/maintenance/FB/showXML.php?identifier=FB-2&ProviderDbase=03

The thing to note here is what followers the php?. There’s something called an identifier, which is set equal to the value FB-2. 2 is the id number of Nile tilapia. Change that to 3 (leave the rest the same) and you get African perch.

We can grab the content of this page in R and parse the XML using these two packages:

[source lang=”r”] fish.id <- 2
url <- paste("http://fishbase.sinica.edu.tw/",
"maintenance/FB/showXML.php?identifier=FB-",
fish.id, "&ProviderDbase=03", sep="")
tt <- getURLContent(url, followlocation=TRUE)
doc <- xmlParse(tt)
[/source]

We create the url with a given fish id. Then the getURLContent line is the equivalent of pointing your browser to that url. Because the page is XML, we then read or parse the page with xmlParse, creating an R object representation of all that XML. We are ready to rock and roll.

If you look closely at the XML, you’ll see all these placed around the information we want, like the scientific names, identifying what they are. For instance, we see the lines that look like this:

[xml] <dwc:Family>Cichlidae</dwc:Family>
<dwc:Genus>Oreochromis</dwc:Genus>
[/xml]

Clearly these are telling us the family and the Genus for this creature. The computer just has to look for the tag (this whole entry is called a node) and that’s the family. The dwc stands for Darwin Core, which is a big language or ontology created explicitly for taxonomic applications. It tells the computer that “Family” in Darwin-Core speak, is precisely the taxonomic meaning of the word. The computer can go and look up the dwc “namespace” given at the beginning of this document to learn exactly what that word means.

To grab this text using R, we simply ask for the value of the node named dwc:Family:

[source lang=”r”] Family <- xmlValue(getNodeSet(doc, "//dwc:Family")[[1]])
Family
[/source]

There’s two commands combined in that line. getNodeSet() is the first, getting any nodes that have the name dwc:Family anywhere (the // means anywhere) in the document. The [[1]] indicates that we want the first node it finds (since there’s only one of these in the entire document). Specifying which node we want makes use of the xpath syntax, a powerful way of navigating XML which we’ll use more later.

The xmlValue command just extracts the contents of that node, now that we’ve found it. If we ask R for the value it got for Family, it says Cichlidae, just as expected.

That was easy. We can do the same for Genus, Scientific Name, etc. As we go down the XML document, we see some of the information we want isn’t given a uniquely labeled node.
For instance, the information for size, habitat, and distribution are all under nodes called . Closer look shows these nodes are under “parent” nodes, all called . If we look at the other “child” nodes of these nodes, we see they also have a node called , like this:

[xml] <dataObject>
<dc:identifier>FB-Size-2</dc:identifier>
… other stuff ….
<dc:description> Text We need </dc:description>
… other stuff ….
</dataObject>
[/xml]

That identifier node tells us that this dataObject has size information. We can grab the content of that dc:description by first finding the identifier that says FB-Size-2, going up to it’s parent dataObject, and asking that dataObject for it’s child node called description. Like this:

[source lang=”r”] size_node <- getNodeSet(doc, paste("//dc:identifier[string(.) =
FB-Size-", fish.id, "’]/..", sep=""))
size <- xmlValue( size_node[[1]][["description"]] )
[/source]

Okay, so that looks crazy complicated — guess we got in a bit deep. See that link to xpath above? That’s a wee tutorial that will explain most of what’s going on here. It’s pretty simple if you take it slow. Using these kind of tricks, we can extract just the information we need from the XML.

Meanwhile, if you want the fast-track option, I’ve put this together in a little R package called rfishbase. The package has a function called fishbase() which extracts various bits of information using these calls. Once you get the hang of it you can modify it pretty easily. I do a little extra processing to get numbers from text using Regular Expressions, a sorta desperate but powerful option when everything isn’t nicely labeled XML.

Using this function we query a fish id number and get back the data in a nice R list, which we can happily manipulate. Here’s a quick demo:

[source lang=”r”] require(rfishbase)

## a general function to loop over all fish ids to get data
getData <- function(fish.ids){
suppressWarnings(
lapply(fish.ids, function(i) try(fishbase(i)))
)
}

# A function to extract the ages, handling missing values
get.ages <- function(fish.data){
sapply(fish.data, function(out){
if(!(is(out,"try-error")))
x <- out$size_values[["age"]] else
x <- NA
x
})

}

# Process all the XML first, then extract the ages
fish.data <- getData(2:500)
yr <- get.ages(fish.data)

# Plot data
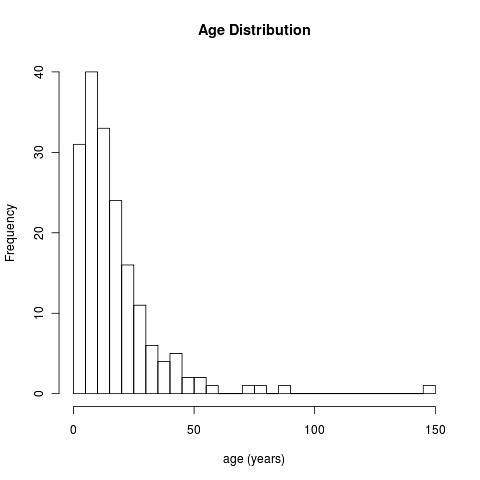
hist(yr, breaks=40, main="Age Distribution", xlab="age (years)");
[/source]

Note we take a bit of care to avoid the missing values using try() function. Here’s the results:

Kinda cool, isn’t it?
Bigger eyes at high latitudes

There is a

growing body of evidence that light levels have a profound effect on the evolution of eyes. Most of these studies deal with comparisons between different species, but now there is a new intriguing twist to the story. In a paper recently published in Biology Letters, Eiluned Pearce and her PhD supervisor Robin Dunbar present data indicating that light levels drive intraspecific variation in visual system size among human populations.

Pearce and Dunbar found a positive correlation between absolute geographic latitude and the size of the eye socket (orbita) and brain cavity in humans. Museum collections house a large number of human skulls with known geographic origin [assuming modern migration can be excluded; the study does not provide the historic age of the skulls], and this came in quite handy for the purpose of this study. Pearce and Dunbar quantified eye size by filling the eye socket with small glass pearls and measuring volume in graduated cylinders, which should be a pretty good proxy of eye volume. Brain cavity was filled with wax beads, instead. To account for scaling effects, they measured the size of the foramen magnum (that’s the large, round skull opening at the base of the skull), a well-supported proxy for body mass in humans. All in all, Pearce and Dunbar measured skulls from 12 different populations (55 skulls total), with a good range of geographic latitudes (1-64deg).

One might think that the correlation between latitude and visual system size may be partially driven by shared ancestry of populations, because many of the high latitude populations have small genetic distances. However, this is apparently not the case: a phylogenetically informed linear model yielded equivalent results.

So, why do human populations at high absolute latitudes have larger eyes? Well, it may indeed be related to light levels. Illumination and day length decrease with an increase in absolute latitude, which means that populations in the far North and South are exposed to lower light levels. And large eye size may improve light sensitivity. Let’s focus on this in more detail.

A large eye can have a larger optical aperture (pupil), i.e., more light can enter the eye chamber. However, the higher number of photons entering the eye does not necessarily result in better light sensitivity, somewhat in contrast to what Pearce and Dunbar say. The light-gathering capacity of an eye also depends on the size of the retinal image, or, the size of the area over which the photons are spread out or distributed. As a larger eye can also have a longer focal length, the retinal image will be larger, as well.

Physiological optics provides simple equations that help to predict how to optimize sensitivity. For example, light sensitivity to extended sources is approximated by means of the f-number (focal length/aperture diameter) or the optical ratio (aperture/[retinal diameter x focal length]). Both proxies are ratios and hence they are independent of eye size. It’s the relative size of the aperture that matters.

However, there is another possible mechanism to improve light sensitivity. The optical system is obviously only one part of the visual system. Another pathway is to increase summation, or the convergence of photoreceptors on ganglion cells. Summation increases light gathering capacity at the cost of visual acuity. So, how does visual acuity compare among different populations? Visual acuity can be approximated by the ratio of focal length/ganglion cell density. If the degree of summation, i.e., density of ganglion cell does not vary among populations then populations with large eyes should have better acuity. Intriguingly, this is not the case as Pearce and Dunbar show, which strongly suggests that populations at high latitudes have higher summation and, accordingly, better light sensitivity.

It is possible that the requirement to maintain good visual acuity at lower light levels drives the evolution of larger eyes in high-latitude populations. Thanks for a great article, and I hope that many of you will now get the calipers (glass pearls, laser-scanners, you name it) out and measure eye size in non-human subjects.

Where do they get all those wonderful videos?

This blog is also posted on my personal blog.

I joined the Wainwright lab in October of last year. While I had experience with swimming fish, including high-speed video analyses, I had not done any filming of fish feeding. At the beginning of this year I got my first taste of obtaining high-speed videos of fish suction feeding. Since that time I have been amazed at the diversity of fish the lab studies (for example, check out the Inimicus didactylus video), the speed of the strikes, and kinematics during the strike; some of the little fish have quite a big gape to capture their prey. The data we are gathering is allowing us to get a glimpse of the patterns of diversity in the kinematics during suction feeding among various species of marine fish, as well as the potential morphological and mechanical correlates of that kinematic data.

Many of the videos that we obtain as a result of this research we upload to our Youtube channel to share with the public, usually the best videos, in focus and lateral. When we film we always try to get focused and lateral sequences for subsequent digitizations. These clear lateral videos allow us to digitize several landmarks on the fish during the strike sequence to get several kinematic variables such as maximum gape, time to pre capture, and ram speed to name a few. But we don’t just need clear lateral videos to showcase on Youtube; we mainly need clear videos to be able to track the landmarks throughout the sequence, and we need lateral videos to obtain accurate kinematics. For example, if the sequences are not clear, it may be harder to track a landmark and there may be more error because the points may drift. If the fish isn’t completely lateral, we may not be able to see all the points, or if the fish as at an angle (going into the third dimension, such as toward the back of the aquarium, which we don’t capture in the 2-dimensional video) the kinematic variables may not be accurate. So, there is a reason for us obtaining these clear lateral videos. However, we also recognize that some of these strike sequences are pretty amazing, so we share them on Youtube.

Lately, our videos (especially the Inermia vittata video you can see in a previous post) have attracted the attention of several science, news and tech blogs. Thank you to all that have posted our videos. However, obtaining these videos is not always easy work, something else that I have learned since being a part of the Wainwright lab. Obtaining these sequences can sometimes (and often) take lots of hours of filming, patience, and hard work. Much of this depends on the fish or the species. Some fish are very good performers, and obtaining several good sequences does not take long (for example the Histrio histrio you can in another previous post). Others require some training to get the fish use to the lights required to capture the sequences at 1000 frames per second. Furthermore, not every fish feeds perfectly lateral every time, or we have multiple individuals in the aquarium that all want food, and the fish themselves are not always perfect. In fact, there are plenty of instances when the predator will miss the prey. This itself is interesting; a former Wainwright Lab member Tim Higham has done some work on the accuracy of strikes, what makes a predator accurate and what can make them miss? Perhaps having a farther strike distance and faster strike velocity decreases accuracy, but to compensate, species have larger gapes to ingest a greater amount of water to increase chances of prey capture (e.g., Higham et al. 2007). We recently posted a video on our Youtube channel of some of these ‘outtakes.’ Again, it is not always easy to capture the clear lateral videos and it takes a lot of work, so this video highlights a ‘bad day at the office’.

Patrick Fuller on feeding duty, Tomomi Takada on camera duty during a typical filming session.

So how do we get all these wonderful videos? First, it is almost always a two person job (although Matt has filmed sticklebacks alone). One person feeds the fish, trying to get them in view of the camera, and striking laterally. This job is almost an art form in itself. You have to learn the behavior of the fish; are they sit and wait predators like the frogfish, fast strikers like the white-streaked grouper, or more active swimmers like Inermia vittata? Therefore, the person feeding has to be aware of the fish’s behavior to try and get good sequences. Challenges may also arise is there are multiple individuals.

Another view of a filming session

We want to ensure all fish eat and we want to get sequences from all individuals, so the person feeding has to keep track of the fish or target the various individuals. The other person involved in the process is the person responsible for tracking the prey and predator, focusing the camera and triggering the high-speed camera. This job is also not easy. It takes some skill to track and focus and quickly trigger the camera. We film at 1000 frames per second and many of the videos on Youtube are played back at 10 frames per second. So what do these strikes actually look like in real time, how much time does the person manning the camera have to respond? To demonstrate this we made a video of a full sequence captured during filming,  in real time and about 200ms of that sequence played back at 10 frames per second for comparison. The person on camera duty has 3 seconds to trigger. You can see from the video, the person responsible for this part of filming either has, or hopefully obtains quick reflexes!

Although our Youtube channel features some of the best sequences we capture, keep in my mind we always strive to get the best videos. And the next time you see one of our videos on Youtube or elsewhere remember that one video is probably the product of hours of work. I want to also note that many of these videos are the work of undergraduate assistants we have in the lab. Many of our Youtube ‘stars’ were captured by our undergraduates, their assistance has been greatly appreciated and many of these videos would not have been captured without them.

Size, Scales and Sceloporus

This weeks blog (also posted on my blog) is a departure from fish, but is about a recent paper of mine that uses phylogenetic comparative methods to test hypotheses for body size and scale evolution among Sceloporus lizards.

Oufiero, C.E.$, G.E.A. Gartner$, S.C. Adolph,  and T. Garland Jr. 2011. Latitudinal and climatic variation in scale counts and body size in Sceloporus lizards:  a phylogenetic perspective. In press  Evolution. DOI: 10.1111/j.1558-5646.2011.01405.x
$ These authors contributed equally

This summer the lab has a reading group on phylogenetic comparative methods, where we are reading through some of the classic phylogenetic papers discussing the various methods. This past week we focused our attention on phylogenetic generalized least squares methods or PGLS. This method was introduced by Grafen in 1989, and although it wasn’t initially a common phylogenetic comparative approach, has seen more use in recent years. For those not familiar with this method, it utilizes a regression approach to account for phylogenetic relationships. In this method the phylogeny is converted to a variance-covariance matrix, where the diagonals in the matrix represent the “summed length of the path from the root of the tree to the species node in question (Grafen 1992).” That is, how far each tip is from the root; in an ultrametric tree the diagonals in the variance-covariance matrix will all be the same. The off diagonals represent the “shared path length in the paths from the root to the two species (Grafen 1992)”. In other words, the off diagonals are the distance from the root to the last common ancestor for the two species. Similar to independent contrasts, this method assumes Brownian motion evolution; however, unlike independent contrasts PGLS assumes the residual traits are undergoing Brownian motion evolution, whereas independent contrasts assumes the characters themselves are undergoing Brownian motion evolution. The other main difference  in PGLS is the use of raw data instead of computing independent contrasts. In short, the PGLS approach is similar to a weighted regression, where the weighted matrix is the variance-covairnace matrix based on the phylogeny of the group, and assuming the same phylogeny will produce the same results as independent contrasts.

So what does this have to do with size, scales and Sceloporus? Well, in a recent study we used a PGLS approach to examine patterns of body size and scale evolution in relation to latitude and climate among Sceloporus lizards. Sceloporus (fence and spiny lizards) are a group of more than 90 species of lizards found from Central America up to Washington State in the U.S. Throughout their range they experience a diversity of habitats, from deserts to tropical forests to temperate forests; and have been used in many studies examining physiological ecology, life history evolution and thermal biology. In our study we used Sceloporus to test two hypotheses for the evolution of morphology. 1) Lizards  exhibit an inverse Bergmann’s Rule, with larger individuals found at lower latitudes and/or warmer climates. 2) Lizards from hotter environments will exhibit fewer and thus larger scales to aid in heat dissipation; whereas lizards from colder environments will exhibit more/smaller scales to aid in heat retention. There has been conflicting results for these hypotheses in the literature, and latitude has often been used as a proxy for climate. However, one of the unique things about our study is the incorporation of multivariate techniques to describe habitat. We use latitude as a predictor as well as climatic variables (temperatures, precipitation and a composite aridity index Q), and also utilize principal component analysis to characterize habitat. We therefore can test for specific climate predictors of these traits without assuming that higher latitudes necessarily equate to colder environments.

To test our hypotheses we gathered data on 106 species and populations of Sceloporus from the literature and museum specimens. We obtained latitude from the literature and source maps, and climate date from the International Water Management Institute’s World Water and Climate Atlas (http://www.iwmi.cgiar.org/WAtlas/Default.aspx). Using a recent phylogenetic hypothesis for Sceloporus (Wiens et al. 2010) we examined the relationship between maximum snout-vent length with latitude and 5 climatic predictors under three models of evolution (no phylogenetic relationships (OLS), Brownian motion (PGLS) and a model in which the branch lengths are transformed in an Ornstein-Uhlenbeck process (RegOU). To examine hypothesis 2 we examined a multiple regression with dorsal scale rows as the dependent, body size as a covariate and latitude or one of the 5 climatic predictors as independents. We also compared results with principal components 1-3 as predictors of dorsal scale counts.

So what did we find? First, we found that phylogenetic models (PGLS or RegOU) were always better fit than non-phylogenetic (OLS) based on likelihood ratio tests and AICc scores. We also found that as latitude increases mean and minimum temperatures decrease, as well as precipitation and aridity, but maximum temperature tends to increase. Thus, lizards from this group found at higher latitudes may be experiencing more desert like environments. 

For hypothesis 1, we found support for the inverse of Bergmann’s Rule when viewed from a climatic perspective; larger lizards were found in areas with higher maximum temperatures, but not at lower latitudes. We also found that larger lizards were found in more arid environments.

Photo copyright Mark Chappell

Our results for hypothesis 2 were a little more complex. We did not find support for the first part of hypothesis 2, lizards with fewer scales were not found in hotter environments. We did find support for the second part of hypothesis 2, lizards with more scales are found in environments with lower minimum temperatures. We also found a positive effect of latitude, and a significant negative effect of aridity (with lizards with more scales inhabiting more arid environments). Results with principal components were also consistent, with PC1  (a latitude/temperature axis) having a significant negative effect on scale count; and PC2 (a maximum temperature/precipitation axis) having a significant positive effect.

Our results suggest several things. First, latitude alone may not be an accurate description of the environment organisms face, particularly at the finer spatial scales over which an individual species may exist. Second, we found support for the inverse of Bergmann’s Rule at the inter-specific level, which has also been found to be a consistent trend intra-specifically in some ectotherms (see Ashton and Feldman 2003). Finally, our analyses suggest that both temperature and precipitation (hence aridity) are important to the evolution of scale counts in this group. These findings also suggest that scale size may be important for other physiological processes, such as evaporative water loss (lizards in more arid environments may have more/smaller scales to reduce rates of evaporation through the skin as has been suggested by Soulé and Kerfoot 1972 ). Examining the relationship of morphological traits that may function in physiological processes may provide insight into how these organisms may respond to global of climate change.

© 2024 Wainwright Lab

Theme by Anders NorenUp ↑